For administrators
Download the group report PDF
Turn the group comparison into a document you can put in front of the leadership team.
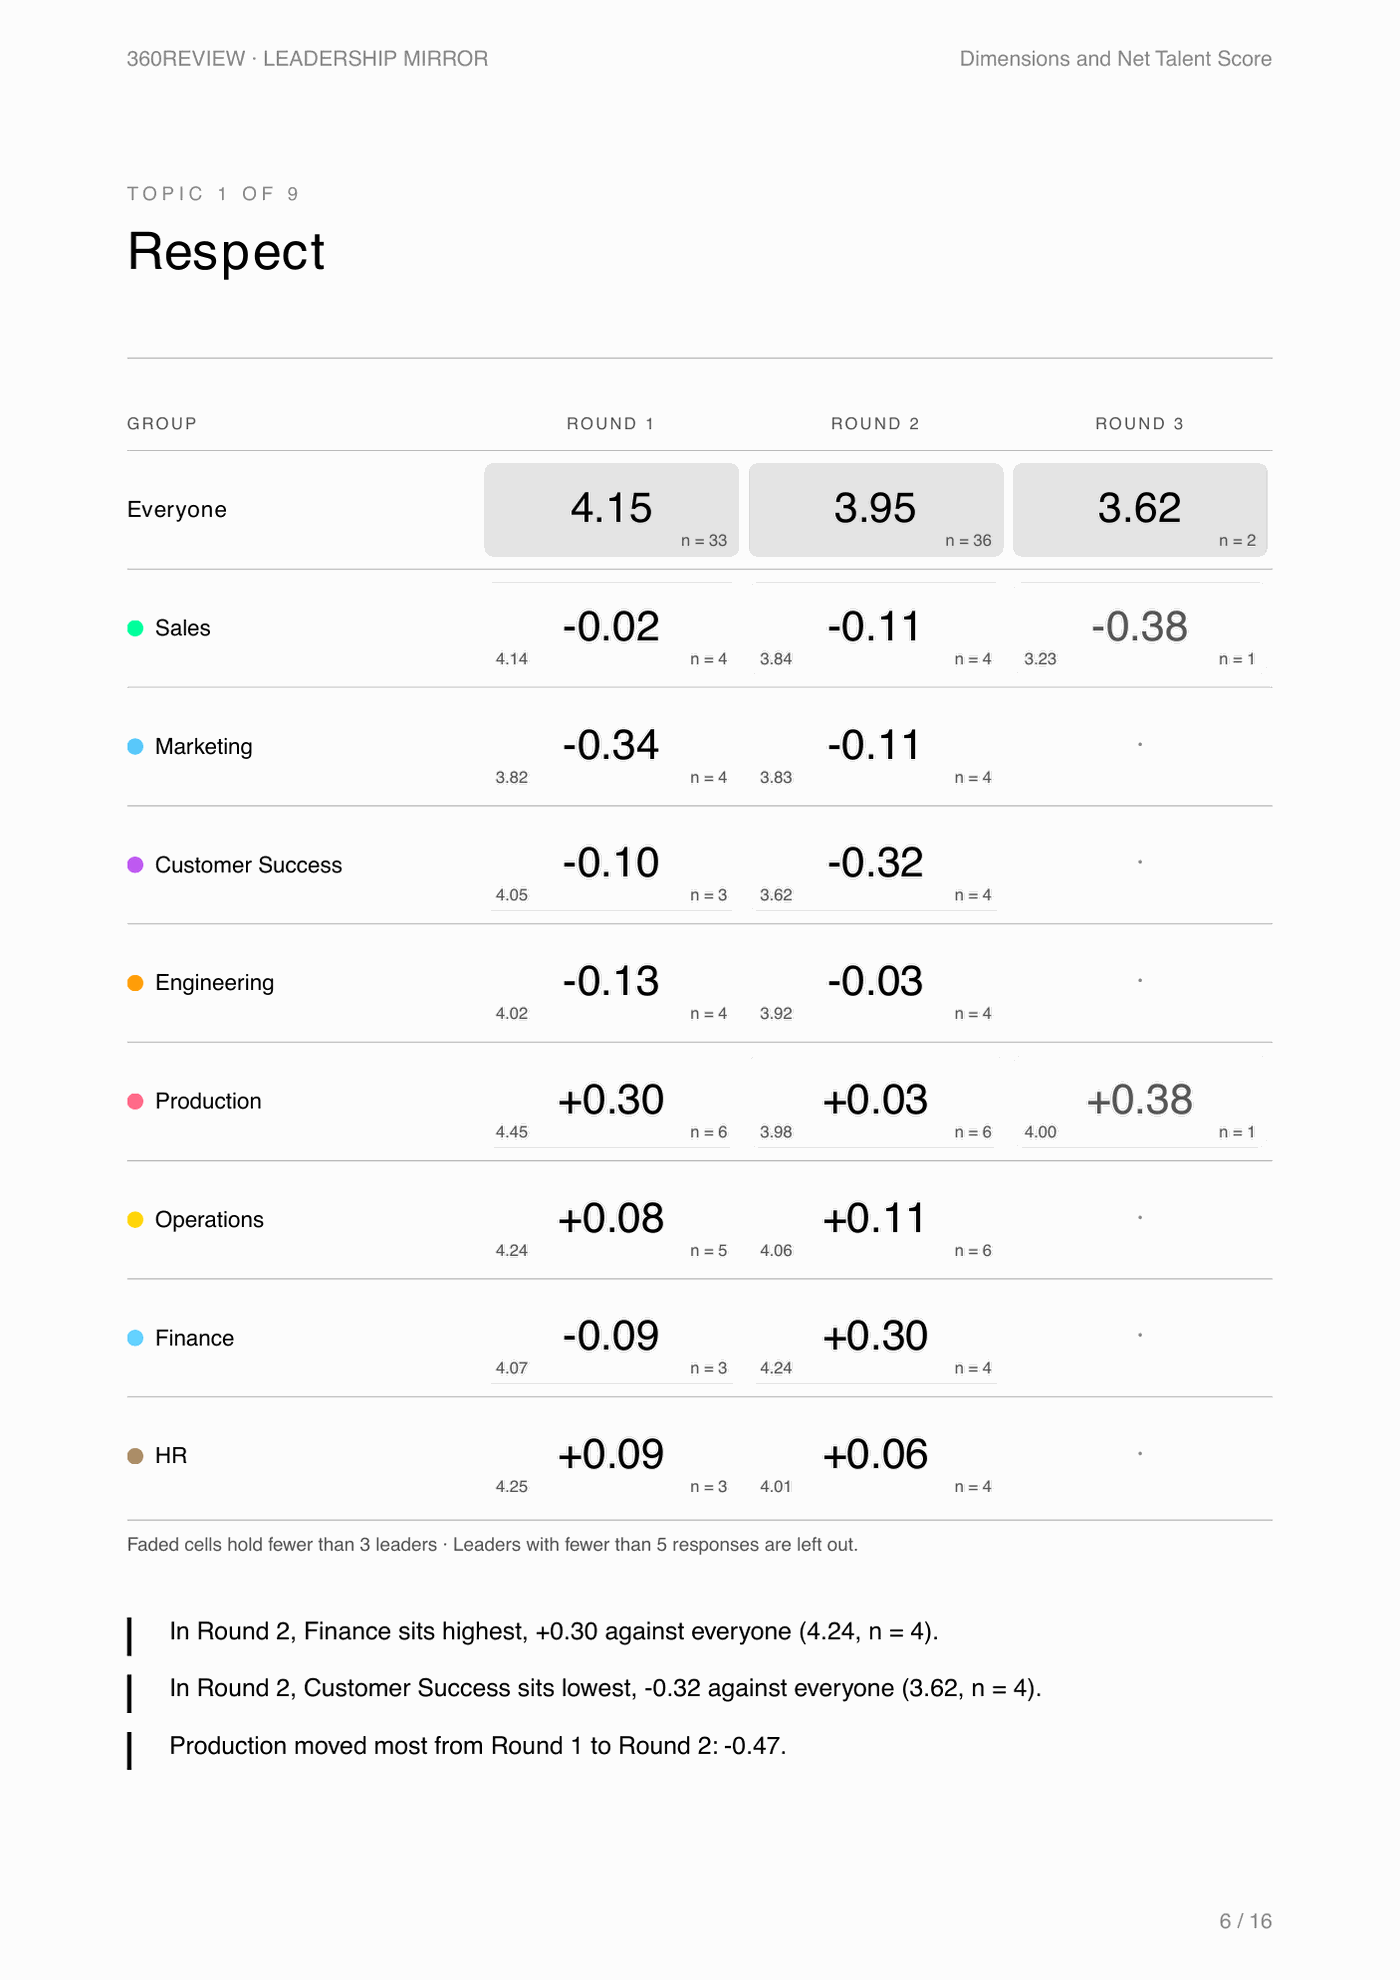
The group comparison on screen is for you. The PDF is for everyone else, such as the leadership team, the HR director or the board. It shows groups, not individual leaders. A group with only 1 or 2 leaders is shown faded. Its number is that one leader's result, or the average of the two.
Generate it

- Press "Compare groups" and pick the category you want to report on.
- Press "Generate report" and choose "This category", or "All categories" for one document that covers every category in turn.
- The PDF downloads to your computer. It takes a few seconds; the button says so while it works.
What is inside
- A short page on how to read the report, written for someone new to 360review.
- Participation: how many of each group's leaders are counted, 360 by 360. A leader is counted once 5 or more people have answered.
- An overview of the overall average, then one page per dimension and one for the Net Talent Score. Each page has the grid of groups, one column per 360, and 3 plain-language lines: who sits highest, who sits lowest, and who moved most.
- Strengths and opportunities by group: for each group in the latest 360, the 2 dimensions furthest above everyone and the 2 furthest below.
Who to share it with
Share it with anyone accountable for the group as a whole. Keep each leader's own report between you and that leader. The "All categories" version has about 13 pages per category, so for a short meeting pick one category.
The PDF includes every group, faded ones too. If a faded group would show a leader's own result to people who should not see it, pick a category with bigger groups, or share the PDF more narrowly.
The dashboard walkthrough shows where the report sits in the flow of a 360. The admin demo has a working download.
Up next: Run a second 360 →